


Key takeaways:
- The effective application of physics-based modeling and simulation is seen as a critical core functionality in the product development decision-making process.
- The need for innovative model-based design and analysis technologies that can connect performance analysis data, processes, and knowledge across functional domains is critical as product complexity continues to grow even as product development cycles continue to be shortened by competitive pressures.
- Rapidly generating CAE analysis results and sharing a compressed 3D file representation in a web-based, interactive, and visual environment is an industry best practice today.
- Unfortunately, the vast majority of engineering organizations still rely heavily on static CAE reports in MS Word, PowerPoint, or pdf formats and ad hoc verbal presentations to other engineers in the organization (CAE, design, manufacturing, etc.) as well as to engineering management to support key product design decisions.
- A market survey conducted by CIMdata in conjunction with VCollab and the ASSESS Initiative explored the role of current collaboration techniques and their impact in the participating organizations, with a view of adoption from both the management level as well as at the engineer and CAE technologist levels.
Today’s Market Drivers and the Need for Change
Manufacturing enterprises are facing many new business and product development challenges that require changes in long-established business practices and engineering processes. Product development is increasingly complex, requiring performance analyses and validation across multiple engineering physics (structural, thermal, fluid flow, noise, crash/impact, durability/fatigue, etc.), often at globally distributed sites in virtual enterprises including supply chains.[1]VCollab 11-4-21 F0
Product simulations span multiple physics domains and each domain can require multiple 3D modeling, results post-processing, and solver applications. As such, CAE users need to deal with different and often incompatible input and output data formats. In addition, file sizes have dramatically increased making it more difficult and costly to process, transmit, and store the large 3D CAE models and results files that are generated by today’s CAE activities.
CAE results are often time-dependent and comprise 3D data fields with directional information. Such tensor data cannot be transmitted, represented, or visualized in standard 3D CAD-related formats such as JT or 3D PDF.
New modeling and simulation tools in the areas of multi-disciplinary optimization (MDO), robust design, model-based systems engineering (MBSE), and big data analytics are compounding data complexity and highlighting the need for capturing analysis best practices via process automation to minimize human error. Even with the new tools available in the Simulation Data and Process Management (SDPM) area, there is often no easy way to visually share, manage, and track 3D analysis results and visually evaluate performance simulation results for design alternatives vs. requirements, especially across multiple simulation tools and domains. Too often today, there is limited design and analysis collaboration in project teams consisting of multiple physics disciplines as well as functional domains that span organizational silos.
Widespread access to powerful 3D simulation tools is also continually expanding via high performance computing (HPC) and Cloud/SaaS access, not only for dedicated CAE specialists as both creators and consumers of 3D simulation models and analysis results but also for design and manufacturing engineers as consumers of that key 3D product performance data.
There is an increasing need and desire to “democratize” simulation and make the 3D analysis results available to a much wider audience than just the CAE specialists to support faster design decisions. Satisfying this need includes the communication of visual analysis results in ways that retain as much critical engineering information as possible but presented in an interactive and compact 3D format that is customized for the specific product issues of concern.
All of these industry trends and market drivers put increased emphasis on the need to enhance the productivity and effectiveness of the relatively scarce, experienced CAE analyst resources; in generating, sharing, and archiving their CAE results in a collaborative process and in a visually interactive 3D format that is readily understandable by other key domains in the product development process.
Key Results and Findings from CIMdata Market Survey
During Q3, 2021, CIMdata conducted a web-based market research survey in conjunction with VCollab and the ASSESS Initiative to better understand the current state of the industry in the area of CAD/CAE process collaboration and the key challenges and business opportunities that face engineering/product development organizations as they move towards a digital engineering environment based on dynamic 3D models versus static documentation. CIMdata conducted the same survey with a subset of our industry contacts and also analyzed a few industry use case applications viewed as “best in class” in this area.
Besides gathering background information on the respondents (title/role, industry, geography, size of company by revenues, and location of engineering teams), the survey posed questions covering the individual’s perspective on the current best practices in their organization in the area of CAE reporting and the way in which critical design performance information is shared among engineering product development teams to make product design decisions.
The majority of the survey respondents work in the automotive/transportation industry (48%) with the remainder spread across a number of industry segments led by aerospace and defense, heavy equipment/industrial machinery, and high-tech electronics.
In a bit of a surprise based on previous CIMdata surveys, responses were strongest from the Asia/Pacific region (42%) followed by the Americas (39%) and EMEA (19%). But the responses by size of organization were in line with the overall engineering software industry profile based on CIMdata’s experience with performing similar PLM market surveys for many years.
Perhaps not surprising given the impact of the COVID-19 pandemic combined with the long term trend towards global distribution of product development, only 22% of the simulation/CAE teams were co-located in the same physical offices as their engineering and management stakeholders.
The survey results were analyzed for the entire data set as well as by the title of the participants grouped into a management role (34%) vs. a technical end user role (66%). (See Figure 1) Interestingly, most of the questions highlighted no significant differences in answers between the management group and the user group. This was a very encouraging result.
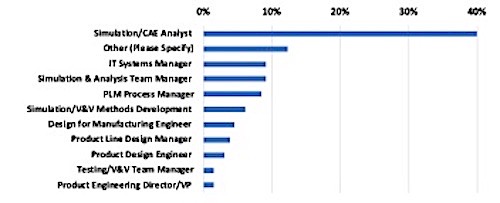
Figure 1—Roles of Survey Respondents
Simulation Importance and Use Throughout the Lifecycle
Question: How important is product performance simulation in your company’s product design decision-making process?
Question: During what stages of the product development lifecycle is simulation used?
Not surprisingly, both manager and user groups were in strong agreement that the use of physics-based simulation and analysis is now very important in the product development process (88% of respondents) and were generally in agreement on when it was being used during the product life cycle (Figure 2). While simulation is still being widely used in traditional ways in the upfront product design, development, and validation activities, it is significant that more simulation is being used to evaluate design for manufacturing requirements and to evaluate the reliability of products in-service in their “as used” environment (Figure 3).
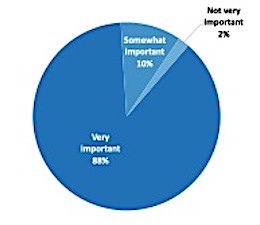
Figure 2—Importance of Product Performance Simulation in Company’s Design Decision-Making Process
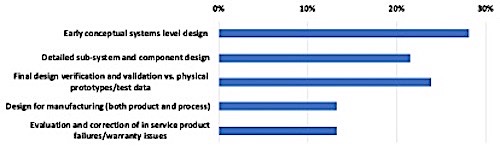
Figure 3—Simulation Use Throughout the Product Lifecycle
Simulation Report Utilization
Question: How is the simulation/CAE report used in your organization?
The manager and user groups were generally in agreement on how the CAE results information was shared with other parts of the product development organization (Figure 4) but there are multiple ways in which the CAE analysts share simulation results with other disciplines within the enterprise including supply chain partners.
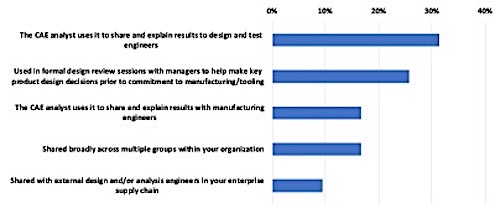
Figure 4—Simulation Reports Sharing and Use Within the Organization
Interaction Among Simulation/CAE, Product Design, and Physical Test Teams
Question: What is the interaction model of your simulation/CAE team with your physical test and product design teams?
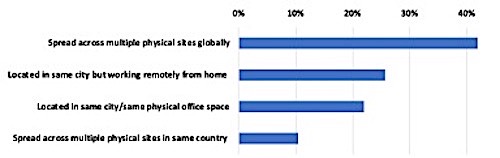
Figure 5—interaction Model of Simulation/CAE Team with Product Design and Physical Test Teams
Given the globalization of product development over the past several decades now combined with the impact of the COVID-19 pandemic for the past 2 years, we wanted to understand what the typical interaction models are in organizations today (virtual vs. physically co-located). See Figure 5. It is obvious that the traditional model of engineers being physically co-located in the same faculties has become more of an exception rather than the norm.
How CAE Results are Shared for Design Collaboration
Question: What are the primary methods used to communicate and share your CAE/simulation results with your product design and physical testing organizations?
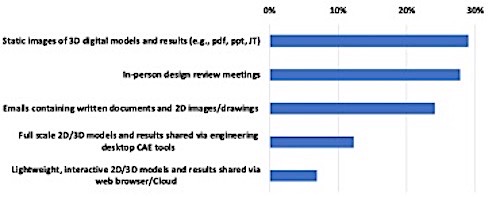
Figure 6—Methods for Sharing Simulation Results Among Simulation, Design, and Physical Test Functions
Question: What digital tools are used to communicate and share CAE results?
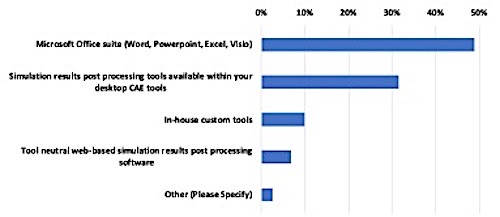
Figure 7—Digital Tools Being Used to Share CAE Results
No major surprise in these results but the current status is disappointing, nonetheless. The use of Microsoft Office applications such as Word and PowerPoint are still dominant for documenting and archiving CAE reports. Static PDFs are widely used as well for sharing and archiving CAE results in a lighter weight format to avoid sharing and storing larger size files in the Microsoft Office formats as well as in the native CAE tool formats.
And in a related question: What is the company standard format for documenting and archiving the final simulation/CAE project report?
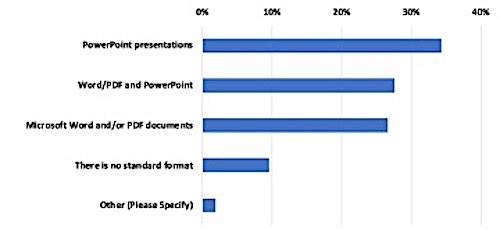
Figure 8—Standard Digital Reporting Formats Being Used
Productivity of CAE Analysts in CAE Reporting Process
The survey next posed a series of questions that explored the time spent by CAE analysts in generating their initial CAE reports as well time spent on generating updates to their analyses based on design change requests from the product development organization. The management group answers were closely aligned with the user group answers indicating a high level of visibility by management with the level of effort devoted to CAE results reporting.
Question: What percentage of your analyst team’s time is spent creating CAE reports?
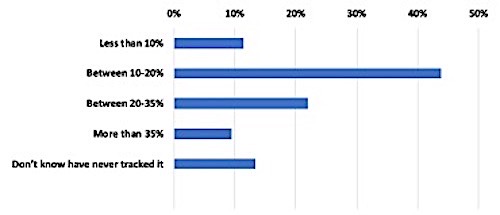
Figure 9—Analyst’s Time Spent Preparing CAE Reports
As shown in Figure 9, nearly two thirds of the respondents spend between 10% and 35% of their time generating CAE reports and between 20-25% spend more than 35% or have not even tracked how much time they spend generating those reports. This highlights a significant area for improvement in terms of the efficiency in generating and sharing CAE results as well as improving the productivity of experienced CAE analysts—a relatively scarce resource in most companies.
Question: How often do you have to edit and update your initial CAE reports to generate and share additional information requested by the product design and/or testing engineers during the product development process? (Figure 10)
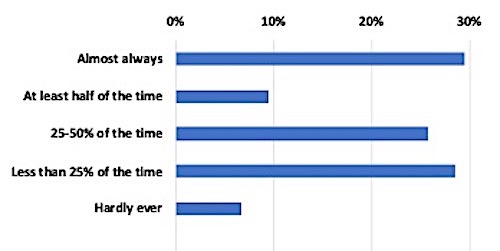
Figure 10—Frequency of CAE Report Updates
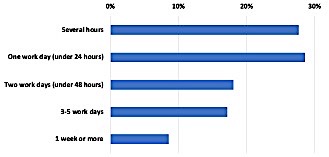
Figure 11—Analyst Time Required to Update Reports
Again, these results, shown in Figures 10 and 11, highlight a significant area for CAE process improvement in terms of the timeliness and efficiency of reacting to product design changes during the development process and the related productivity of CAE analysts in updating the analysis results.
Repeatable CAE Reporting and Process Automation
The concept of leveraging templates and/or customizable apps has grown substantially over the past decade and virtually all of the CAE vendors provide some level of analysis process automation within their physics-based modeling and simulation platforms. Automation has been widely applied to analysis pre-processing (model creation/automated meshing, etc.) and the analysis solution process areas but to a somewhat lesser extent to the analysis post-processing area. So we wanted to understand where companies were in the adoption of automated reporting processes to ensure the use of repeatable and validated CAE “best practices” across their engineering organizations.
Question: What % of your CAE projects are repeatable standard work processes (i.e., are created often, have consistent content, and reporting formats) and therefore strong candidates for project reporting to be created automatically via templates? (Figure 12)
Question: How automated is your process for creating CAE reports? (Figure 13)
Figures 12 &13—Left: Repeatable, Standard Work Processes Employed
Right: Report Generation Automation
These survey results highlight several findings of note from a CIMdata perspective:
- The generation of CAE reports and the sharing of 3D product performance analysis information is still largely a manual ad hoc activity that relies heavily on written reports captured in traditional Microsoft Office documentation tools (Word, PowerPoint, Excel, etc.). Sharing of results and collaboration with other engineering stakeholders is done primarily with static documents that cannot be used to understand CAE results outside the scope prepared by the CAE analysts at the time the report was generated.
- A significant percent of CAE analyses can be treated as “standard work” based on proven best practices and is therefore a strong candidate for simulation process automation including automated reporting.
- There exist significant opportunities to increase the productivity and efficiency of CAE analysts in post-processing and creating CAE reports and there is also significant room for improvement in enabling better collaboration among engineering teams to leverage CAE results to achieve better and more rapid engineering decision-making across the product development process.
- A relatively small percentage of engineering organizations are taking advantage of the kind of web-based, interactive 3D CAE report automation and collaboration technology provided by VCollab (see Figure 6 as well).
To explore the business value proposition of the VCollab technology, we evaluated several real world VCollab customer use cases where process impact metrics are currently available.
A major U.S. automotive Tier One supplier highlighted the following business benefits aligned with improving CAE/engineering productivity and collaboration across product design teams.
- CAE efficiency—Dramatically reduced times for CAE report creation and editing
- Reports created up to 90% faster with VCollab Report Automation Templates
- Analysts and engineers post-process directly using the 3D digital reports—75% faster
- Better communication with design stakeholders via 3D Digital Reports
- Enables faster, more confident design decisions by product engineering teams
- Enables results validation across global analysis teams that is not possible with traditional 2D reports
- Minimize human error with Process Automation
- VCollab data mining automates identification and annotation of model hot spots
- Maximize CAE report repeatability; delivering consistent format and content
- VCollab CAX results files are 80 to 95% smaller than native CAE results files
- Global transfer of CAE results is more practical and much faster
- Archiving and access to critical simulation results in SPDM and PLM systems
Simulation experts at GKN Automotive in the US and Mexico also use VCollab to share simulation results with design engineers and other internal and external customers. They also highlighted the business benefits in terms of engineering efficiency and productivity as well as a tangible impact on better decision making via increased design collaboration.
A Knowledge-Based Engineering manager from GKN Automotive commented: “VCollab has more than lived up to our expectations for making it faster and easier to create simulation reports. Instead of spending additional time producing slide decks of static 2D results for our customers, VCollab lets us quickly and easily create 3D results which they can pan, zoom, rotate, and animate, to understand the simulation more completely and thoroughly. This has led to better and faster design decision-making.”
For those interested in more information on the CIMdata survey questions and the results, please contact CIMdata at info@cimdata.com.
Conclusion
CIMdata believes we are still in the early adopter stages of implementing web-based CAE/CAD collaboration technologies such as VCollab, primarily due to the design process changes required within today’s engineering organizations to take advantage of state-of-the-art tools. As the survey results indicate, there is still much work to be done but there is also great opportunity and tangible business impacts to be realized by industry in effectively implementing these emerging technologies in engineering and product development as well as other domains such as manufacturing, quality assurance, maintenance, and in-service operations. Just as the lightweight JT 3D CAD format has had a significant impact on the product design community over the past several decades, we anticipate lightweight and interactive CAE data representations in tools such as VCollab to provide a similar impact on the way that critical CAE information is generated, collaboratively shared for decision making and efficiently archived for re-use throughout the lifecycle and in establishing digital traceability of CAE models and results.
[1] Research for this commentary was partially supported by VCollab.